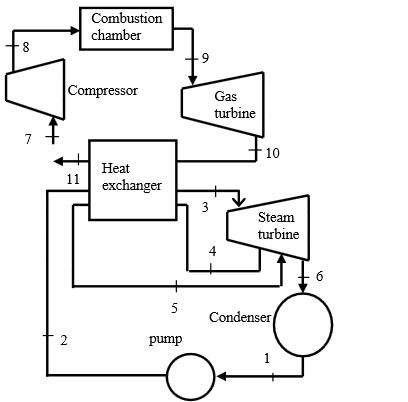
Hey guys, another research update for you all! So last time, I talked about fatigue pre-cracking my rail specimens and how the fatigue process worked. Basically, I needed to fatigue pre-crack my specimens in order to get a crack that would mark a path for the rest of the crack to follow. This process is to help with da/dN testing, which is a test that measures the change in crack length per change in number of cycles. Since I had fatigue pre-cracked a dozen specimens, I then began conducting the da/dN tests.
So da/dN…. What does that mean and why is it so significant? Well, as I mentioned before, it’s basically the rate at which a crack grows for a given cyclic loading on a specimen. What we are essentially trying to find from this type of test are 2 things:
1. The cyclic loading at which there is no longer a crack growth rate- this is important because it allows us to find the Kmin Threshold value. This is the minimum stress intensity factor (proportional to load) that a crack starts to grow at. In other words, a what load do you stop creating a crack on the specimen.
2. The slope of the da/dN vs Delta K graph. Basically, as long as the increase or decrease in crack growth rate maintains itself steady and moderately linear, then we can characterize the behavior of the crack for a given load and predict what the crack growth rate will be at a given time.
So the past month has consisted of these tests, but just like the fatigue pre-cracking, it has been a little tough figuring out the best way to go about these experiments. To give you an example, I ran a crack growth rate test a several weeks back and obtained the following results:

Now compare this experiment to one that was performed by a certain railroad company.

So as you can see, there is definitely something wrong with what I was doing and it took time to figure out what was wrong. Apparently, the reason why my data was so distorted was because I had stored the data points was based on the number of cycles and not on the crack length. So in some instances, I would receive negative crack growth rates because the strain gauge would measure a smaller crack length at certain instances (remember it’s cycling, so there is sinusoidal amplitude that can give you positive and negative numbers), which would cause a negative difference. So although you may think, “Duh, isn’t that obvious??”, small little issues tend to occur very often and one always has to be on the lookout for small problems like these in order to obtain accurate results. Nonetheless, I think I’m starting to get the hang of all this da/dN testing and can now start running these tests with ease. Here’s a graph of one of the good tests that I ran:
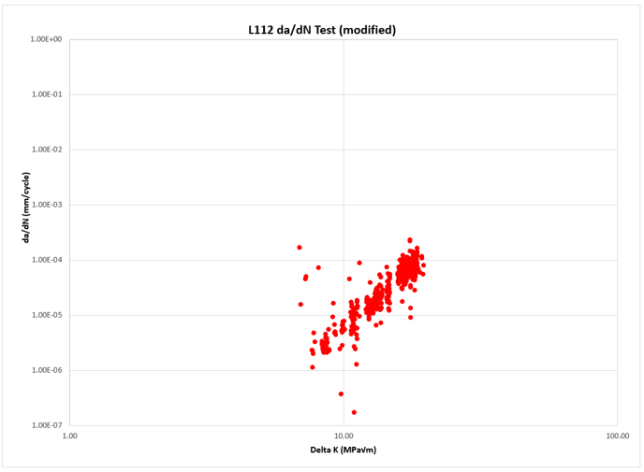
So as the change in stress intensity factor Delta K increases, the crack growth rate obviously increases because the specimen’s area gets smaller and because your putting larger load on it as well.
So that’s where I’ve been essentially with these tests. I’ll be sure to get a fracture toughness test in soon enough and hope that the tests are valid. More updates to come!